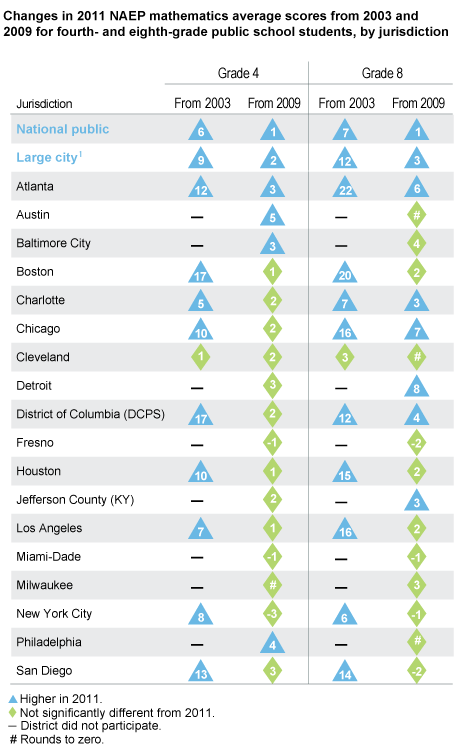
Few districts score higher in 2011 than in 2009
Of the 18 districts that participated in the 2009 assessment (see figure on the right), only Atlanta students scored higher in 2011 at both grades 4 and 8. Fourth-graders also scored higher in 2011 in Austin, Baltimore City, and Philadelphia. Eighth-graders scored higher in 2011 in Charlotte, Chicago, Detroit, the District of Columbia, and Jefferson County.
See complete figures and tables for grade 4 and grade 8.
Use the grade 4 District Motion Chart and the grade 8 District Motion Chart to visualize performance changes over time.
Six districts scored higher than large city schools nationally at both grades
At grade 4, scores for Austin, Boston, Charlotte, Hillsborough County (FL), Houston, Jefferson County (KY), Miami-Dade, and San Diego were higher than for large cities nationally. At grade 8, scores for Austin, Boston, Charlotte, Hillsborough County (FL), Houston, and San Diego were higher than the scores for large cities nationally.
See interactive charts that show district comparisons for grade 4 and grade 8.
Score gaps between higher- and lower-income students persist in most districts
At grade 4, scores for lower-income students in Austin, Boston, Charlotte, Dallas, Hillsborough County (FL), Houston, Miami-Dade, and New York City were higher than the score for lower-income students in large cities. The score gaps between higher- and lower-income students in Boston and Detroit were smaller than the score gap for large cities overall. At grade 8, scores for lower-income students in Austin, Boston, Dallas, Houston, and New York City were higher than the score for lower-income students in large cities. The score gaps between higher- and lower-income students in Dallas, Detroit, Houston, Miami-Dade, and New York City were smaller than the score gap for large cities overall. (Family income level is determined by eligibility for the National School Lunch Program).

1Large city includes students from all cities in the nation with populations of 250,000 or more including the participating districts.
NOTE: Beginning in 2009, results for charter schools are excluded from the TUDA results if they are not included in the school district�s Adequate Yearly Progress (AYP) report to the U.S. Department of Education. The score-point differences appear within each symbol and are based on the differences between unrounded average scores. A score-point difference preceded by a minus sign (-) indicates that the score was numerically lower in 2011. DCPS = District of Columbia Public Schools.
SOURCE: U.S. Department of Education, Institute of Education Sciences, National Center for Education Statistics, National Assessment of Educational Progress (NAEP), 2003, 2009, and 2011 Mathematics Assessments.