|
Close window
HELP
How do I ... ?
Navigate this site
The content on this website can be accessed at any time using the left-hand navigation bar or the menu that drops down from the left side of the banner. Use the navigation bar to:
- Select a report for a subject area;
- Choose results for the nation, states, or districts;
- View sample questions;
- Read information tailored to the interests of parents, educators, researchers, policymakers, or reporters; or
- Get more information about NAEP.
Back to Top
Use tabs
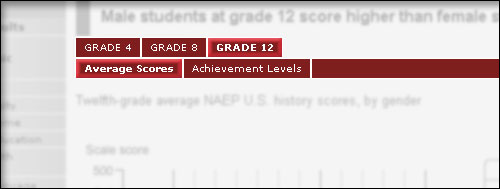
When you see tabs at the upper right of a page or chart, you can click on a tab to get an alternate subject, grade, or view. For instance, in the image below you can choose data for grade 4 or grade 8. When you are viewing a page of a report card, you can choose grade-level graphics, graphics showing scale score or achievement-level results, or graphical views by student groups (where available).
Try it! Move the mouse pointer over this image
to explore how to use tabs.
Back to Top
View Flash and SVG charts
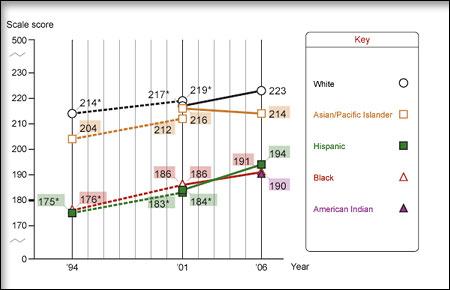
Some charts on this site are presented as interactive Flash files or Scalable Vector Graphics (SVG). You can hide certain data by clicking the descriptor in the Key, then show it by clicking the descriptor again. You may need to download the Flash Player or SVG Viewer or use a specific web browser to use this feature.
Try it! Move the mouse pointer over this image
to explore how to hide and show chart items.
Back to Top
Download recommended Flash Player and SVG Viewer
Flash
 The NAEP website presents certain material in the form of Flash animations. In order to view these animations, you will need to install a Macromedia Flash Player, version 9 or higher. Refer to Macromedia's Flash support center for assistance in working with the Flash Player. The NAEP website presents certain material in the form of Flash animations. In order to view these animations, you will need to install a Macromedia Flash Player, version 9 or higher. Refer to Macromedia's Flash support center for assistance in working with the Flash Player.
Scalable Vector Graphics
 Scalable Vector Graphics (SVG) is a W3C recommendation (web standard) for a graphics file format and web development language based on XML. Although many SVG viewers are available, NAEP recommends the Adobe SVG Viewer 3.0, or the use of the native SVG viewer built into Mozilla Firefox 1.5 or higher. If you are using Internet Explorer, visit the Adobe's SVG Page for more information and to download a free viewer. NOTE: The Adobe SVG viewer is not available for the Vista operating system. Scalable Vector Graphics (SVG) is a W3C recommendation (web standard) for a graphics file format and web development language based on XML. Although many SVG viewers are available, NAEP recommends the Adobe SVG Viewer 3.0, or the use of the native SVG viewer built into Mozilla Firefox 1.5 or higher. If you are using Internet Explorer, visit the Adobe's SVG Page for more information and to download a free viewer. NOTE: The Adobe SVG viewer is not available for the Vista operating system.
Back to Top
Close window
|